You can use Matplotlib to create a line chart with Python. Matplotlib is a plotting library for the Python programming language and its numerical mathematics extension numpy.
Python Courses
Complete Python Programming Course & Exercises
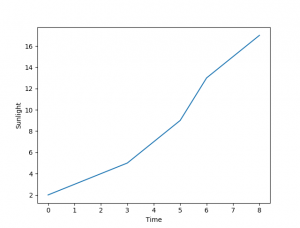
Line chart
The code creates a line plot in a graphical desktop window. This takes only a few lines. The dataset can be any set of numbers, in the example below we simply picked some random numbers for x.
import numpy as np |
In the first two lines we include the numpy and matplotlib library. This contains logical functions to create line charts amongst others.
We define a list named x with a few random numbers and we set the x and y label. Finally we call the function show() which will display the line chart. If you do not call the show() function, nothing will be shown on the screen.
Line plot colors
Plots support theming. It’s very easy to change the color of the line or the shape of it. By changing the plot function call to:plt.plot(x, 'ro-')